
The first day of summer is also #ShowYourStripes Day, a time for meteorologists to draw attention to climate change using red and blue stripes.
SACRAMENTO, Calif — You may see meteorologists share pictures of red and blue stripes online. These stripes are called climate stripes or warming stripes, and are used to draw attention to our warming planet.
They're becoming increasingly more common, but what do they represent, what is the science behind them and what does it tangibly mean for Sacramento?
In 2018, University of Reading climate scientist Ed Hawkins published the first climate stripes as a way to make it easier to visualize how global average temperatures have changed since the mid-19th century.
These stripes don't show projected warming, only warming that has been observed. In other words, they don't show what could happen, only what's already happened.

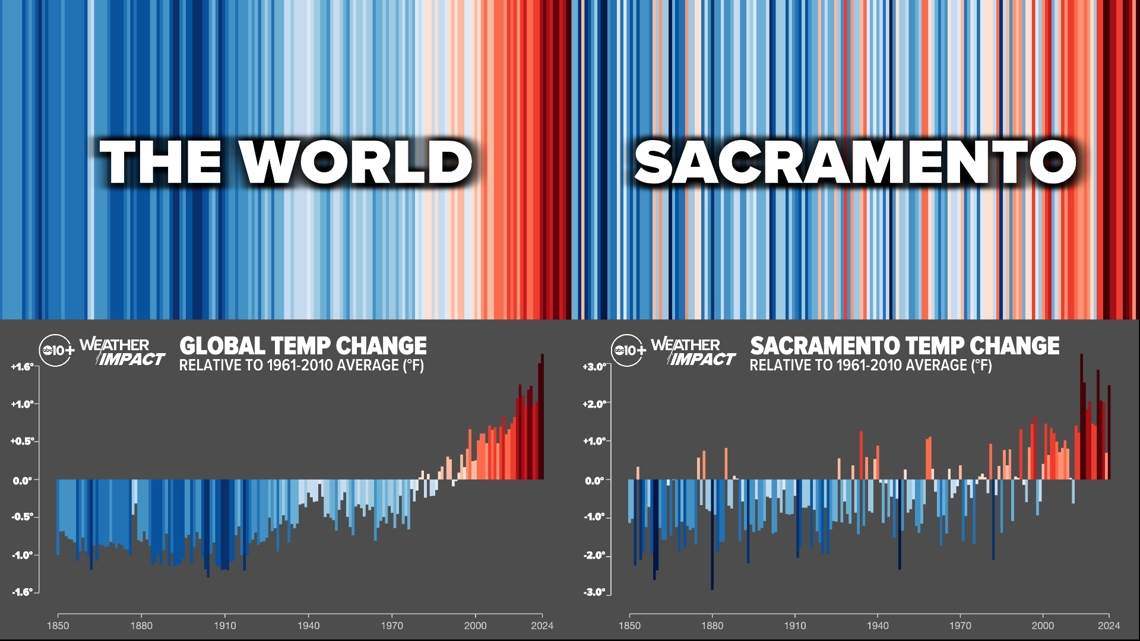
The stripes for the globe show how our climate has changed since the Industrial Revolution. Starting in 1850 on the left and ending in 2024 on the right, each stripe represents one year. The blue colors indicate years cooler than the 1961-2010 baseline, and the red years indicate years warmer than the 1961-2010 baseline. Notice how almost every year since about 1980 has been warmer than the baseline average. Also notice how much warmer the last 20 years have been.
The climate stripes for Sacramento show a very similar story, with most years prior to 1980 cooler than the 1961-2010 average and most years after 1980 much warmer. But the global stripes and Sacramento stripes don't match up perfectly, and that's because not everywhere is warming at the same rate. However, the general pattern is the same: cooler in the past, warmer in the present.
What is causing this change? Humans.
Since the Industrial Revolution in the second half of the 19th century, humans have emitted more and more carbon dioxide and other greenhouse gases. Theses gases are called greenhouse gases because – like a greenhouse – they capture heat and store it, and these greenhouse gases last decades or more in the atmosphere.


As atmospheric carbon dioxide concentrations have increased (as of this writing, global CO2 was over 428 parts per million) so too has the global average temperature, and it follows almost perfectly. We know this is due to human emissions and not some naturally occurring cycle because current atmospheric CO2 is at a level unseen for more than one million years.
What this is doing is shifting our climate baselines. Our normal days today are warmer than they were 50 years ago and significantly warmer than 100 years ago! This shifting climate means more extreme heat days and sometimes it means we see days so hot they would be almost impossible without climate change.
For Sacramento, we're seeing this shift in a few ways. For one, Sacramento has significantly more 100°+ days than 100 years ago. Between 1877 and 1907, Sacramento averaged just six 100°+ days a year. Between 1993-2023, Sacramento averaged 24 100°+ days a year.
But beyond just triple digits, Sacramento is seeing warmer temps in general. In summer specifically, Sacramento is averaging 14 more days of additional above average days than just 50 years ago, or two additional weeks every summer of temperatures warmer than they should be.
A lot of our summertime warming is occurring during the overnight.

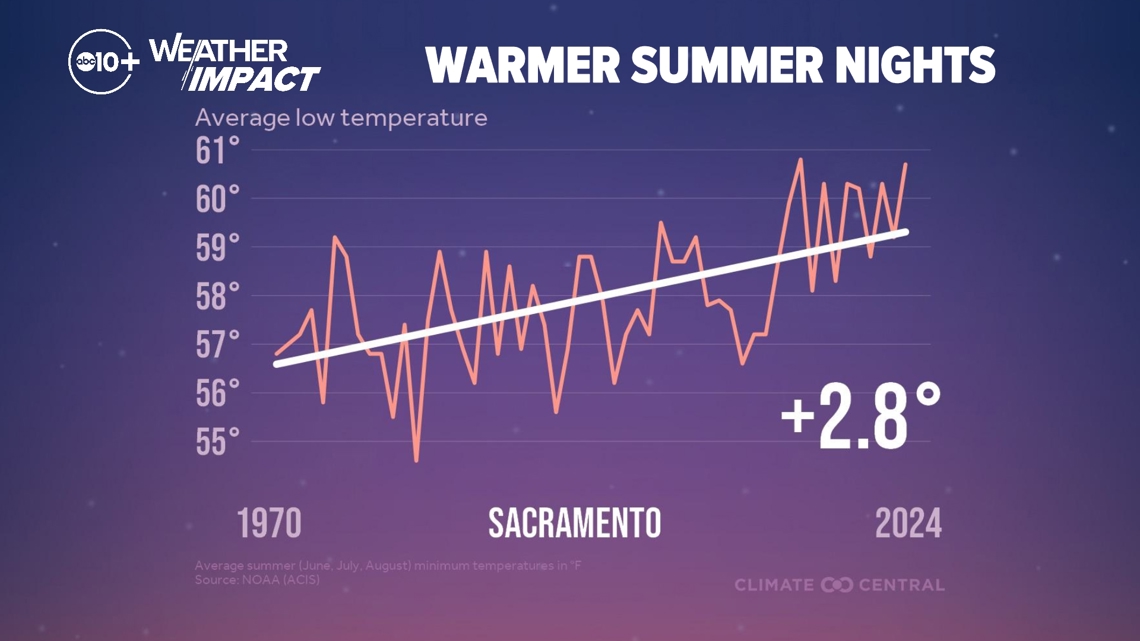
Since 1970, Sacramento's average summertime low temperature has increased by almost three degrees from about 56° to 59°, so if you've lived in the area for a few decades and think it feels warmer than it used to, you'd be right.
Climate change is a dynamic issue and it's easy to get overwhelmed by all of the data, which is the point of the stripes. It's an easy way to visualize the changes occurring in our atmosphere and it's a great starting place to explore what those changes mean for us on the ground.


 English (US) ·